100Africa.com Report
1. Introduction: The Monetary Paradox of Modern Africa
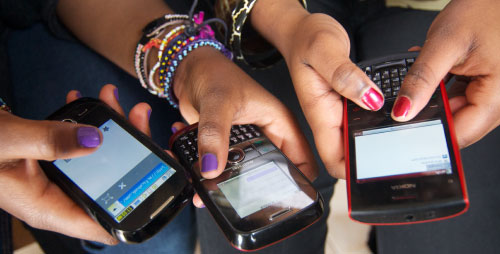
The economic narrative of Africa in the early 2020s is frequently framed through the lens of technological leapfrogging—a continent bypassing traditional banking infrastructure in favor of fintech solutions, mobile money, and digital innovation. However, a granular examination of central bank data across fifty African nations reveals a divergent, more complex reality. Beneath the digital veneer lies a deepening entrenched reliance on physical cash, predominantly held outside the formal banking system. This report, covering the volatile period from 2020 to 2024, posits that “Currency Outside Banks” (COB) acts not merely as a residual monetary aggregate but as the primary circulatory system for a vast, unmeasured economic ecosystem.
The data indicates that in major economies such as Nigeria, Egypt, and Kenya, as well as in fragile states like Sudan and Zimbabwe, the volume of currency released by central banks but not circulating within the commercial banking system has surged to historic levels. This phenomenon is not merely a symptom of low financial inclusion; rather, it is a structural feature of the “Real Economy”—the informal sector. This sector, often estimated to comprise between 30% to over 60% of GDP in various jurisdictions, suggests that official Gross Domestic Product figures are significant underestimates of actual economic activity.
Furthermore, this liquidity disconnect points to the existence of a “Shadow Wealth” class. High Net Worth Individuals (HNWIs) and profitable corporate entities operate within this cash-dominant sphere, accumulating substantial assets in real estate, commodities, and foreign currency that remain invisible to tax authorities and national accounts. The implications for monetary policy transmission, fiscal sustainability, and development planning are severe. As central banks tighten rates to curb inflation—a trend dominant in 2023 and 2024—the cash-based informal economy remains largely insulated from these signals, rendering traditional monetary tools blunt and often ineffective.
This report synthesizes data from Annual Reports, Monetary Policy Statements, and Statistical Bulletins from African central banks, alongside international datasets, to map the scale of this unbanked money and articulate its profound economic implications across the continent’s distinct regions.
2. West Africa: The Epicenter of Cash Hoarding and Monetary Volatility
West Africa represents the most dynamic and volatile theatre for currency usage on the continent. The region comprises the monolithic economy of Nigeria, the inflationary environment of Ghana, and the disparate economies of the West African Economic and Monetary Union (WAEMU) and the West African Monetary Zone (WAMZ). The period from 2020 to 2024 has been defined by aggressive policy attempts to curb cash usage, which have largely backfired, entrenching cash as the preferred store of value.
2.1 Nigeria: The Structural Decoupling of the Populace
The Central Bank of Nigeria (CBN) provides the most dramatic case study of the disconnect between monetary policy and monetary reality. Following a disastrous currency redesign policy in late 2022 and early 2023, which was explicitly intended to “mop up” excess liquidity and force the informal economy into the banking net, cash holdings initially plummeted due to scarcity but rebounded with aggressive velocity. By October 2024, Currency Outside Banks (COB) hit an all-time high of N4.29 trillion, representing over 94% of the total Currency in Circulation (CIC).1
This statistic is profound in its implication: for every N100 printed and issued by the CBN, approximately N94 ends up in private vaults, pillowcases, underground storages, or active informal trade networks, never returning to the banking system to create credit or be leveraged for formal economic expansion.1 The failure of the currency redesign—which caused severe economic contraction in Q1 2023—demonstrated the resilience of the cash economy. Rather than digitizing, the informal sector developed robust parallel mechanisms for clearing and settlement using physical cash, effectively rejecting the banking system as a safe harbor for savings.3
The drivers of this surge are multifaceted. Persistent inflation, which eroded the purchasing power of the Naira, incentivized the rapid turnover of cash in trade rather than dormant savings in low-interest bank accounts. Furthermore, the “trust deficit” widened significantly; the inability of citizens to access their own deposits during the cash crunch of 2023 caused permanent behavioral changes, where holding physical cash became equated with financial security.4 The CBN’s data confirms that despite the proliferation of fintechs and mobile money agents, the absolute volume of physical cash required to sustain the Nigerian economy continues to grow, suggesting a bifurcation where the formal sector digitizes while the informal sector—estimated at 57% of GDP—doubles down on cash.5
2.2 Ghana: Inflationary Spirals and the Velocity of the Cedi
In Ghana, the trajectory of currency outside banks has mirrored the country’s struggle with hyper-inflationary pressures and debt distress. The Bank of Ghana (BoG) reported an explosive increase in currency in circulation, rising from GH₵ 44.5 billion in 2023 to GH₵ 71.6 billion by December 2024, an increase of more than 60% year-on-year.7 This surge occurred against a backdrop of headline inflation reaching 23.8% at the end of 2024 and a sharp depreciation of the Cedi.8
The “Fisher Effect” is clearly visible here: as prices rise, the volume of cash required for daily transactions increases proportionally. However, the data suggests more than just transactional demand. The structural rigidity of COB in Ghana points to the dominance of the informal trading sector, particularly in commodities like cocoa and gold. The “Galamsey” (illegal small-scale mining) sector operates almost entirely in cash, generating billions of Cedis that circulate outside the purview of the Ghana Revenue Authority. This cash fuels a shadow consumption economy, evident in the disconnect between official income statistics and the high consumption of luxury goods and real estate development in Accra and Kumasi.9
2.3 The WAMZ Fragility: Sierra Leone, Liberia, and The Gambia
In the smaller economies of the West African Monetary Zone (WAMZ), the ratio of currency outside banks to total money supply is even more extreme, reflecting deep structural informality and low trust in sovereign currencies.
Sierra Leone: The Bank of Sierra Leone (BSL) has struggled with a monetary environment where the vast majority of issued currency resides permanently outside the banking system. At the end of 2023, currency outside banks constituted a staggering 93.9% of total currency in circulation.11 This indicates that the banking sector in Sierra Leone essentially services the government, NGOs, and a few large importers, while the general populace operates autonomously in a cash-based ecosystem. The BSL’s attempts to tighten monetary policy by raising rates are largely theoretical in their impact on the general public, as the transmission mechanism is severed by the lack of banking intermediation.12
Liberia: The Central Bank of Liberia (CBL) operates in a dual-currency environment where the US dollar circulates alongside the Liberian dollar. The “Currency Outside Banks” metric here is complicated by the significant volume of physical US dollars held by the public—a “shadow money supply” that the central bank cannot accurately measure or control. While the CBL reported a slight decline in Liberian dollar COB in early 2024, it remains the primary driver of broad money supply, confirming the economy’s reliance on physical cash for almost all domestic commerce.13
The Gambia: The Central Bank of The Gambia (CBG) reported robust growth in monetary aggregates driven by remittance inflows. However, a significant portion of these remittances, often arriving via money transfer operators, are immediately withdrawn as cash and vanish into the informal economy. The CBG’s focus on targeting reserve money is continually challenged by this leakage, which fuels demand in the property and retail sectors without deepening financial intermediation.15
2.4 The Francophone Zone (WAEMU): Stability vs. Reality
The countries of the West African Economic and Monetary Union (Benin, Burkina Faso, Côte d’Ivoire, Guinea-Bissau, Mali, Niger, Senegal, Togo) share a common currency, the CFA Franc, and a common central bank, the BCEAO. While the currency peg to the Euro provides stability, it does not prevent the dominance of the informal cash economy.
Reports from the BCEAO indicate that while aggregate liquidity is managed at a regional level, the distribution of cash varies wildly. In countries like Mali and Burkina Faso, political instability and security challenges have eroded trust in financial institutions, leading to increased cash hoarding as a survival mechanism. In Niger, the informal economy is estimated to be 56.3% of GDP, one of the highest in the world.17 The “Currency Outside Banks” in these jurisdictions effectively funds cross-border trade and smuggling routes that bypass customs and tax authorities, sustaining regional integration through informal rather than formal mechanisms.18
3. East Africa: The Paradox of Digital Leadership and Cash Persistence
East Africa is globally renowned for its mobile money revolution, led by Kenya’s M-Pesa. Yet, the data from 2020 to 2024 reveals a counter-intuitive trend: despite digital ubiquity, the demand for physical cash is growing, not shrinking. This suggests a hybrid economy where digital tools facilitate velocity, but cash remains the ultimate settlement asset and store of value for the unbanked wealth.
3.1 Kenya: The Digital Facade and the Cash Reality
The Central Bank of Kenya (CBK) oversees perhaps the most digitally integrated financial system on the continent. Yet, the CBK’s 2024 Annual Report reveals that cash in circulation increased by 5.6% to KSh 333.8 billion in the year to June 2024.20 Even more telling is that withdrawals from banks outpaced deposits, indicating a net leakage of cash from the formal system into the informal economy.20
This persistence of cash in a digital giant is driven by several factors. First, the agricultural sector, which contributes over 20% to GDP, relies heavily on cash for payments to smallholder farmers and casual laborers. Second, the “Jua Kali” (informal) sector prefers cash to avoid the transaction costs associated with mobile money (such as excise taxes and withdrawal fees) and to evade the digital trail that could lead to tax compliance enforcement by the Kenya Revenue Authority (KRA). The aggressive taxation measures proposed in the Finance Bill 2024 likely exacerbated this “flight to cash,” as businesses sought to minimize their digital footprint.21 The grey-listing of Kenya by the FATF in 2024 further highlighted the real estate sector as a major sink for illicit cash, where properties are transacted in physical currency to launder proceeds of corruption and tax evasion.23
3.2 Ethiopia: The Giant’s Shadow Economy
Ethiopia presents a different scale of challenge. With a population exceeding 120 million and a shadow economy estimated at 50.2% of GDP 17, the National Bank of Ethiopia (NBE) grapples with a massive volume of unbanked currency. The conflict in the Tigray and Amhara regions during the review period forced large swathes of the economy into a cash-only mode for survival, severing banking links.
The “Birr” circulates within a closed loop of informal trade, particularly in the sesame, coffee, and khat sectors. The “Hundi” or “Hawala” system manages the wealth transfer of the diaspora and the trading elite, completely bypassing the NBE’s official reserves.24 Periodic demonetization efforts by the government to force money into banks have typically resulted in short-term spikes in deposits followed by a return to cash hoarding as trust remains low. The NBE’s data shows that broad money supply expansion is consistently driven by claims on the government and currency outside banks, reflecting the inflationary financing of deficits and the public’s preference for cash amidst negative real interest rates.25
3.3 Tanzania and Uganda: Resource Wealth in Cash
In Tanzania, the Bank of Tanzania (BoT) reported strong growth in credit and deposits, yet currency outside banks continued to expand steadily. This is closely linked to the artisanal mining sector (gold) and the agricultural export sector (cashew, tobacco), where transactions at the primary producer level are almost exclusively cash-based. The shadow economy in Tanzania is estimated at 44.7% of GDP 17, implying that nearly half of the country’s economic output is settled in cash and largely untaxed.27
Similarly, the Bank of Uganda (BoU) reported a 9% increase in currency in circulation for the 2024/25 financial year, reaching Shs 8.98 trillion.29 The BoU attributed this to economic recovery and high demand for cash in rural areas. Despite the growth of agent banking and mobile money, the “net outflow” of cash from the central bank confirms that once currency leaves the vault, it tends to stay in the public domain, circulating within the informal economy rather than returning as deposits.30
3.4 Somalia and South Sudan: The Dollarized Shadows
In Somalia, the Central Bank of Somalia (CBS) is in the process of rebuilding a national currency, but the economy essentially operates on US dollars and mobile money. The “Currency Outside Banks” concept here is unique because the “bank” (the CBS) historically had little control over the money supply. The informal “Hawala” system is the de facto banking system, moving billions of dollars in remittances that sustain the economy but appear nowhere on the national balance sheet.32
South Sudan faces a similar but more chaotic situation. The Bank of South Sudan (BoSS) has struggled with hyperinflation and rapid depreciation of the South Sudanese Pound. Consequently, the economy has dollarized. The “wealth” of the nation is held in physical US dollar stacks by elites and traders, completely outside the domestic banking system. The BoSS statistics on currency in circulation capture only the depreciating local currency used for small transactions, missing the true monetary base of the country.34
4. Southern Africa: Commodity Cycles, Dual Currencies, and Inequality
Southern Africa is characterized by the dominance of the South African economy and the profound instability of Zimbabwe, alongside resource-rich nations like Zambia and Angola. The monetary data here reflects the region’s extreme inequality and dependence on commodity cycles.
4.1 South Africa: The Township Economy Anomaly
While South Africa boasts the most sophisticated financial system on the continent, the “Currency Outside Banks” metric remains resilient. This is driven by the “Township Economy”—spaza shops, the taxi industry, and informal services—which is a multi-billion Rand ecosystem running almost entirely on cash. The South African Reserve Bank (SARB) notes that despite digital payment proliferation, cash in circulation continues to rise relative to nominal GDP.36 This “shadow economy,” estimated at around 29% of GDP, supports millions of livelihoods but complicates tax collection and financial regulation. The rise in cash usage is also a reflection of the “grey economy” attempting to evade the scrutiny of the South African Revenue Service (SARS).37
4.2 Zimbabwe: The Currency Graveyard
Zimbabwe represents the most extreme example of monetary dysfunction. The Reserve Bank of Zimbabwe (RBZ) introduced the “Zimbabwe Gold” (ZiG) in April 2024 to replace the collapsed ZWL.38 This marked the sixth attempt at currency reform in two decades. However, analysis of 2024 reports indicates that the economy remains heavily dollarized. “Currency outside banks” in Zimbabwe effectively refers to US dollars held by households—phenomenon known as “mattress banking.” These funds are estimated to be in the billions, far exceeding the official reserves of the central bank. The “Gold Mafia” investigation revealed how hundreds of millions of dollars in gold proceeds are laundered outside the banking system, representing a massive portion of GDP that is “uncaptured” in official data but fuels the luxury consumption of the elite.39
4.3 Zambia and Angola: The Copper and Oil Standard
In Zambia, the Bank of Zambia (BoZ) reported a substantial 22.4% increase in currency in circulation in 2024, ending the year at K20.2 billion.41 This surge was partly driven by expanded social benefit payments paid in cash, demonstrating how government policy can inadvertently fuel the cash economy. The informal mining sector also absorbs vast amounts of liquidity that rarely returns to the banking system efficiently.
Angola, recovering from recession, saw the Banco Nacional de Angola (BNA) report growth in notes and coins in circulation. However, high inflation (28.2% in 2024) eroded the real value of this cash, forcing a higher velocity of circulation. The informal market in Luanda, dominated by “kinguilas” (money changers), manages a significant portion of the country’s foreign exchange liquidity, creating a parallel exchange rate mechanism that challenges the central bank’s control.42
5. North Africa: The Liquidity Trap of the Giants
North African economies are characterized by large populations and extensive state subsidies, yet they too struggle with massive informal sectors that absorb liquidity.
5.1 Egypt: The Demographic Cash Dividend
The Central Bank of Egypt (CBE) data shows Currency Outside Banks reaching LE 1.4 trillion in August 2025.44 With a population exceeding 100 million and a massive informal service sector, Egypt’s demand for cash is structural. The high interest rates implemented to combat inflation have not sufficiently incentivized deposits from the unbanked sector, which fears tax integration. The “informal economy” in Egypt is estimated at 30-40% of GDP, representing a colossal volume of unrecorded economic activity that sustains the working class but contributes little to the fiscal purse.45
5.2 Algeria: The Problem of Over-Liquidity
The Bank of Algeria faces a unique challenge of “over-liquidity” outside the banks. Reports indicate that over 35% of the total money supply circulates outside the formal banking sector, amounting to trillions of Dinar.46 This is a historical structural issue tied to the informal nature of the commercial sector and a cultural preference for cash settlement to avoid tax scrutiny. The failure to integrate this liquidity into the banking system limits the capacity of banks to finance the diversification of the economy away from hydrocarbons.47
5.3 Morocco: The Resistance to Digitization
Despite a sophisticated banking sector, Morocco sees a persistent preference for cash. The Bank Al-Maghrib (BAM) reported that currency in circulation reached 414.4 billion Dirhams in 2024, equivalent to 30% of GDP.48 The “Tax Amnesty” of 2024 was an explicit attempt to draw this cash back into the formal system, resulting in a deceleration of CIC growth but not a reversal.49 This confirms that a significant portion of cash is held specifically to avoid taxation, supporting a parallel real estate and commercial sector.
6. The Ghost GDP: Implications of the Unmeasured Economy
The vast pools of Currency Outside Banks are the strongest empirical evidence that African economies are significantly larger than their official GDP figures suggest. The “Ghost GDP” is the economic activity facilitated by this unbanked cash.
6.1 Quantifying the Missing Billions
If Nigeria’s informal sector is 57% of GDP, and its official GDP is ~$375 billion (2024), the “true” size of the economy could be undervalued by over $200 billion.5 Similarly, in Tanzania (44.7% informal) and Zimbabwe (>60% informal), the official statistics fail to capture the resilience and volume of trade occurring daily.
- Table 3: Estimated Size of Shadow Economies (2023/2024)
- Nigeria: ~57-65% of GDP (Implied missing value: ~$215bn)
- Sierra Leone: 64.5% of GDP (Implied missing value: ~$2.5bn)
- Zimbabwe: >60% of GDP (Implied missing value: ~$18bn)
- Tanzania: 44.7% of GDP (Implied missing value: ~$35bn)
- South Africa: ~29% of GDP (Implied missing value: ~$116bn)
- Source:.5
6.2 The “Shadow Titans”: Wealth Beyond the Books
The narrative that the informal economy is synonymous with poverty is incomplete. The data points to the existence of “Informal Titans”—High Net Worth Individuals (HNWIs) whose wealth is unrecorded.
- Commodity Barons: Traders in cocoa, gold, and sesame operate multi-million dollar businesses entirely in cash or via trade misinvoicing. This capital often flows into real estate or offshore accounts without ever appearing on a personal income tax return.
- Real Estate Moguls: In cities like Lagos, Nairobi, and Kinshasa, luxury real estate is frequently purchased with cash. This creates a store of wealth that is visible in the skyline but invisible in the tax ledger. The FATF’s grey-listing of Kenya and Nigeria explicitly cited the real estate sector’s vulnerability to money laundering via cash.23
- Trade Misinvoicing: The Africa Wealth Report 2024 tracks formal wealth, but misses the billions lost to trade misinvoicing in the mineral sectors of SADC countries. This “lost” wealth is captured by a shadow elite who exploit weak customs enforcement to under-declare exports, keeping the proceeds offshore or in foreign currency outside the domestic banking system.51
6.3 Fiscal and Policy Blindness
The existence of this Ghost GDP creates a “Fiscal Illusion.” Debt-to-GDP ratios appear dangerously high because the denominator (GDP) is understated. However, the revenue-to-GDP ratio is genuinely low because the state cannot tax the Ghost GDP. This forces governments to over-tax the formal sector (e.g., Kenya’s Finance Bill 2024 protests) or borrow excessively, creating a vicious cycle that drives more economic activity into the shadows to avoid the tax burden.21
7. Policy Responses and the Future Outlook
African Central Banks have employed a range of strategies from 2020 to 2024 to address the “Cash Outside Banks” challenge, ranging from coercion to innovation.
7.1 The CBDC Gambit: A Technological Misstep?
Nigeria’s eNaira, launched in 2021, was explicitly designed to absorb the informal economy. However, adoption has been sluggish. The informal sector prefers the anonymity of cash over the traceability of a CBDC. Other nations like Ghana (eCedi), Rwanda, and Tanzania are exploring CBDCs, but the Nigerian experience serves as a cautionary tale: technology cannot fix a trust deficit.53
7.2 Demonetization: The Blunt Instrument
Nigeria’s 2023 currency redesign and Ethiopia’s periodic demonetizations represent the “shock therapy” approach. While these policies temporarily reduce COB, they often destroy economic value and trust. The rapid rebound of cash in Nigeria post-redesign proves that without addressing the underlying drivers of informality (cost of banking, tax avoidance, lack of trust), coercive measures are futile.3
7.3 The Outlook: The Persistence of the Dual Economy
The trends from 2020-2024 suggest that the “Unbanked” economy is not shrinking; it is evolving. It is becoming a sophisticated, parallel system that interacts with the formal world only when necessary.
- Inflationary Drivers: As long as inflation remains high in key economies (Nigeria, Ghana, Zimbabwe, Sudan), the demand for physical cash (or foreign currency) as a tangible asset will persist.
- Digital Taxation: The increasing trend of taxing digital transactions (e-levies) is inadvertently pushing people back to cash, ensuring that COB figures will likely remain elevated through 2025.
8. Conclusion
The analysis of central bank reports across 50 African nations reveals a startling reality: the “banking system” is an island in a sea of cash. The trillions of units of local currency circulating outside banks are not merely “loose change”; they represent the working capital of a massive, vibrant, and largely untaxed economy.
This Shadow Economy is the true engine of survival for the majority of Africans, but it is also a hideout for a wealthy elite who exploit the opacity of cash to evade contribution to the state. The implication is that Africa is richer than its books suggest, but its states are poorer than they should be.
For investors, this signals untapped market potential in the informal sector—the “Ghost GDP.” For policymakers, it highlights the failure of “coercive financial inclusion.” The path forward requires not just digital tools, but the restoration of trust in the banking system and the creation of economic incentives—such as real interest rates and simplified tax compliance—that make formalization more profitable than remaining in the shadows. Until then, the vaults of Africa’s central banks will remain full of numbers, while the vaults of its people remain full of cash.
Statistical Appendix: Key Monetary Indicators (2023/2024 Estimates)
| Country | Metric | Value | Year/Period | Source |
| Nigeria | Currency Outside Banks | N4.29 Trillion | Oct 2024 | CBN 1 |
| Ghana | Currency in Circulation | GH₵ 71.6 Billion | Dec 2024 | BoG 7 |
| Sierra Leone | COB as % of CIC | 93.9% | Dec 2023 | BSL 11 |
| Kenya | Cash in Circulation | KSh 333.8 Billion | Jun 2024 | CBK 20 |
| Uganda | Currency in Circulation | Shs 8.98 Trillion | Jun 2025 | BoU 29 |
| Zambia | Currency in Circulation | K20.2 Billion | Dec 2024 | BoZ 41 |
| Egypt | Currency Outside Banks | LE 1.4 Trillion | Aug 2025 | CBE 44 |
| Morocco | Currency in Circulation | MAD 414.4 Billion | 2024 | BAM 48 |
| Algeria | Liquidity Outside Banks | ~35% of Money Supply | 2023/24 | BoA 46 |
| Tanzania | Shadow Economy Size | 44.7% of GDP | 2023 Est. | IMF/World Econ 17 |
| Zimbabwe | Shadow Economy Size | >60% of GDP | 2023 Est. | 17 |
(Note: Data derived from aggregated Central Bank reports and economic studies referenced in the analysis).
- Currency Outside Banks Hits N4.29trn In October 2024 – YouTube, accessed January 5, 2026, https://www.youtube.com/watch?v=rifZ3yChW94
- Currency Outside Banks Surges to N3tn, 92% of … – THISDAYLIVE, accessed January 5, 2026, https://www.thisdaylive.com/2024/01/22/currency-outside-banks-surges-to-n3tn-92-of-currency-in-circulation/
- implications of naira redesign on the financial, economic and, accessed January 5, 2026, https://repository.elizadeuniversity.edu.ng/server/api/core/bitstreams/9aa93437-37e5-4fbb-b685-df347679a266/content
- (PDF) Economic instrument or political tool? An assessment of the …, accessed January 5, 2026, https://www.researchgate.net/publication/397265215_Economic_instrument_or_political_tool_An_assessment_of_the_socioeconomic_outcomes_of_the_Central_Bank_of_Nigeria’s_2022_currency_redesign_and_cashless_policy
- Nigeria GDP – World Economics, accessed January 5, 2026, https://www.worldeconomics.com/GDP/Nigeria.aspx
- N264bn Cash Withdrawn from Banks in November, accessed January 5, 2026, https://punchng.com/n264bn-cash-withdrawn-from-banks-in-november-2025/?utm_source=auto-read-also&utm_medium=web
- How Much Money is Circulating? – Modern Ghana, accessed January 5, 2026, https://www.modernghana.com/news/1445217/how-much-money-is-circulating.html
- Annual Report and Financial Statements 2024 – Accra – Bank of Ghana, accessed January 5, 2026, https://www.bog.gov.gh/wp-content/uploads/2025/07/2024-Annual-Report-and-Financial-Statements-1.pdf
- Capturing the African Consumer Market | Atlantic Council, accessed January 5, 2026, https://www.atlanticcouncil.org/wp-content/uploads/2017/09/Capturing_the_African_Consumer_Market_web_0907.pdf
- 2024 Annual Report – Securities and Exchange Commission Ghana, accessed January 5, 2026, https://sec.gov.gh/wp-content/uploads/uploads/Annual-Reports/2024-Annual-Report.pdf
- WEST AFRICAN MONETARY INSTITUTE, accessed January 5, 2026, https://wami-imao.org/sites/default/files/2024-09/WAMI%20Annual%20Report%202023_EN.pdf
- Sierra Leone; 2024 Article IV Consultation and Request for a 38 …, accessed January 5, 2026, https://www.imf.org/-/media/files/publications/cr/2024/english/1sleea2024001-print-pdf.pdf
- FINANCIAL & ECONOMIC BULLETIN – Central Bank of Liberia, accessed January 5, 2026, https://www.cbl.org.lr/sites/default/files/documents/CENTRAL%20BANK%20OF%20LIBERIA%20%28CBL%29%202024%20ANNUAL%20REPORT.pdf
- CENTRAL BANK OF LIBERIA ANNUAL REPORT 2024.pdf, accessed January 5, 2026, https://www.cbl.org.lr/sites/default/files/documents/CENTRAL%20BANK%20OF%20LIBERIA%20ANNUAL%20REPORT%20%202024.pdf
- Monetary Policy Report February 2024 – Central Bank of The Gambia, accessed January 5, 2026, https://www.cbg.gm/downloads-file/774d2ddb-0864-11ef-8725-02e599c15748
- Monetary Policy Report – Central Bank of The Gambia, accessed January 5, 2026, https://www.cbg.gm/downloads-file/833ec0eb-3be6-11f0-8725-02e599c15748
- Mapped: The Size of Each Country’s Shadow Economy, accessed January 5, 2026, https://www.visualcapitalist.com/size-of-the-shadow-economy-by-country/
- Rapport-sur-la-convergence-macroeconomique-de-la-CEDEAO …, accessed January 5, 2026, https://amao-wama.org/wp-content/uploads/2024/11/Rapport-sur-la-convergence-macroeconomique-de-la-CEDEAO-2023.pdf
- West African Economic and Monetary Union: Staff Report on …, accessed January 5, 2026, https://www.elibrary.imf.org/view/journals/002/2025/110/article-A001-en.xml
- Cash in Circulation up 5.6% to KSh 333.8 Bn | The Kenyan Wallstreet, accessed January 5, 2026, https://kenyanwallstreet.com/cash-in-circulation-up-5-6-to-ksh-333-8-bn
- ‘TAX THE RICH!’: CAN KENYA GET WEALTH TAXATION RIGHT?, accessed January 5, 2026, https://ipfglobal.or.ke/wp-content/uploads/2025/12/TAX-THE-RICH-CAN-KENYA-GET-WEALTH-TAXATION-RIGHT_.pdf
- Quarterly Economic Review, April – June 2024 – Central Bank of Kenya, accessed January 5, 2026, https://www.centralbank.go.ke/uploads/quarterly_economic_review/1664300546_Quarterly%20Economic%20Review%20%20April%20-%20June%202024.pdf
- anti-money laundering rules & reporting – GI-ACE, accessed January 5, 2026, https://giace.org/wp-content/uploads/2025/10/AML-Rules-Paper-FINAL.pdf
- ETHIOPIA COUNTRY ASSESSMENT – Migrant Money, accessed January 5, 2026, https://migrantmoney.uncdf.org/wp-content/uploads/2023/02/Ethiopia-Country-Assessment.pdf
- The National Bank of Ethiopia (NBE) Fourth Quarter Report 2023 2024, accessed January 5, 2026, https://www.scribd.com/document/928381039/The-National-Bank-of-Ethiopia-NBE-Fourth-Quarter-Report-2023-2024
- Annual-Report-2022-2023.pdf – National Bank of Ethiopia, accessed January 5, 2026, https://nbe.gov.et/wp-content/uploads/2025/02/Annual-Report-2022-2023.pdf
- #TanzaniaFinance – TICGL, accessed January 5, 2026, https://ticgl.com/tag/tanzaniafinance/
- Bank of Tanzania Annual Report 2022/23, accessed January 5, 2026, https://www.bot.go.tz/Publications/Regular/Annual%20Report/en/2024011812305409.pdf
- Uganda’s Currency in Circulation Rises by Shs 771 Billion in One Year, accessed January 5, 2026, https://nilepost.co.ug/index.php/business/293185/ugandas-currency-in-circulation-rises-by-shs-771-billion-in-one-year
- Bank of Uganda reports rise in expenses and loan adjustments for …, accessed January 5, 2026, https://thecooperator.news/bank-of-uganda-reports-rise-in-expenses-and-loan-adjustments-for-fy-2024-2025/
- Money in Circulation Grows Due to High Demand – Africa-Press, accessed January 5, 2026, https://www.africa-press.net/uganda/all-news/money-in-circulation-grows-due-to-high-demand
- CBS-2024-Financial-Statement.pdf – Central Bank of Somalia, accessed January 5, 2026, https://centralbank.gov.so/wp-content/uploads/2025/05/CBS-2024-Financial-Statement.pdf
- ARP 38 Final Report – Geneva Graduate Institute, accessed January 5, 2026, https://www.graduateinstitute.ch/sites/internet/files/2024-09/ARP-38-Final-Report–2024—-Zeyu-Wei.pdf
- Republic of South Sudan: Third Review Under the Staff-Monitored …, accessed January 5, 2026, https://www.elibrary.imf.org/view/journals/002/2024/327/article-A001-en.xml
- South Sudanese pound – Wikipedia, accessed January 5, 2026, https://en.wikipedia.org/wiki/South_Sudanese_pound
- SARB retail CBDC Background Note, accessed January 5, 2026, https://www.resbank.co.za/content/dam/sarb/publications/fintech/SARB%20retail%20CBDC%20Background%20Note_Final%20November%2020251125.pdf
- Monday 15 September 2025 – Charts – The Outlier, accessed January 5, 2026, https://charts.theoutlier.co.za/filter
- (PDF) The efficacy of the use of ZiG money as a sole legal tender in …, accessed January 5, 2026, https://www.researchgate.net/publication/397221447_The_efficacy_of_the_use_of_ZiG_money_as_a_sole_legal_tender_in_Zimbabwe_The_case_of_Chinhoyi_Town_Zimbabwe
- Six secrets uncovered by Al Jazeera’s Gold Mafia investigation, accessed January 5, 2026, https://www.aljazeera.com/news/2023/4/14/six-secrets-uncovered-by-al-jazeeras-gold-mafia-investigation
- ZIG’s devaluation reflects Zimbabwe’s state of perpetual crisis, accessed January 5, 2026, https://issafrica.org/iss-today/zig-s-devaluation-reflects-zimbabwe-s-state-of-perpetual-crisis
- annual report 2024 – Bank of Zambia, accessed January 5, 2026, https://www.boz.zm/Bank_of_Zambia_2024_Annual_Report.pdf
- ANGOLA – Documents & Reports – World Bank, accessed January 5, 2026, https://documents1.worldbank.org/curated/en/099071825113513565/pdf/P507068-db94883f-4acc-4fce-8f31-284fdf4dc9cf.pdf
- Balanço Do BNA | PDF | Dinheiro | Economia monetária – Scribd, accessed January 5, 2026, https://es.scribd.com/document/656633437/Balanco-Do-BNA
- The Financial Monthly Report -October 2025, accessed January 5, 2026, https://assets.mof.gov.eg/files/8af0ce80-cb68-11f0-8074-97d7d0a0b851.pdf
- Egypt – ISS African Futures, accessed January 5, 2026, https://futures.issafrica.org/geographic/countries/egypt/
- The Digital Dinar and the Transformation of Monetary Policy in Algeria, accessed January 5, 2026, https://asjp.cerist.dz/en/downArticle/515/9/2/281470
- Evolution de la politique monétaire en Algérie face aux chocs …, accessed January 5, 2026, https://asjp.cerist.dz/en/downArticle/154/19/2/279833
- The Impact of Financial Digitization on the Reduction of Cash Usage …, accessed January 5, 2026, https://www.atlantis-press.com/article/126018180.pdf
- Weekly highlights by – L’Economiste, accessed January 5, 2026, https://www.leconomiste.com/wp-content/uploads/2025/11/Weekly-highlights-7144.pdf
- GDP is a Cudgel – and Why Nigeria’s 2025 Rebasing Did Not Go Far …, accessed January 5, 2026, https://medium.com/@legal.options/gdp-is-a-cudgel-and-nigerias-2025-rebasing-did-not-go-far-enough-f18ba78ae841
- Illicit trade in Africa’s natural resources: Experts sound the alarm at …, accessed January 5, 2026, https://www.unisa.ac.za/sites/corporate/default/News-&-Media/Articles/Illicit-trade-in-Africas-natural-resources-experts-sound-the-alarm-at-Unisa-seminar
- Africa’s Dwindling Tax-to-GDP: A Wakeup Call For Social Contract …, accessed January 5, 2026, https://www.thereporterethiopia.com/47352/
- Central Bank Digital Currency and Other Digital Payments in Sub …, accessed January 5, 2026, https://www.imf.org/-/media/files/publications/ftn063/2024/english/ftnea2024001.pdf
- DIGITAL MONEY, REAL IMPACT: – Rwanda Bankers’ Association, accessed January 5, 2026, https://rba.rw/wp-content/uploads/2025/12/Digital-Money-Real-Impact.pdf